
How to Use SmartArt PowerPoint
Release the full possibilities of SmartArt PowerPoint to clearly and visually impactly express your thoughts. From simple insertion to extensive customizing, animations, best practices, and real-world examples, this thorough book addresses all.
In the table below, you can see the types of pre-prepared SmartArt in PowerPoint and see how each one is used for the purpose of your presentation. You can also read the details of each section in Section Overview of SmartArt Categories and Layouts.
|
SmartArt Category |
Description |
Common Use Cases |
|
List |
Displays information in a list format, either vertically or horizontally. | Useful for highlighting key points, listing features, benefits, or steps. |
|
Process |
Illustrates a progression or sequence of steps in a process or workflow. | Ideal for showing timelines, project phases, step-by-step guides, or instructions. |
|
Cycle |
Depicts a circular sequence that represents continuous processes or cycles. | Commonly used to visualize life cycles, product development cycles, or feedback loops. |
|
Hierarchy |
Shows organizational structures or relationships in a top-down format. | Perfect for organizational charts, team structures, or layered concepts. |
|
Relationship |
Demonstrates connections, interactions, or comparisons between elements. | Used for Venn diagrams, cause-effect relationships, or concept connections. |
|
Matrix |
Arranges elements across two axes to show relationships or categories. | Helpful for SWOT analysis, risk assessment matrices, or strategic planning. |
|
Pyramid |
Presents items in a pyramid structure based on priority or hierarchy. | Great for illustrating priorities, layered data, or hierarchical importance (e.g., Maslow’s hierarchy). |
|
Picture |
Combines text with images to create engaging visual representations. | Best for introducing people, products, services, or visual storytelling. |
|
Office.com |
Provides access to additional SmartArt templates from Office.com. | Useful for downloading industry-specific or uniquely designed SmartArt graphics. |
Need a Stunning Presentation with SmartArt?
If you want to create a professional PowerPoint presentation using SmartArt, but don’t have the time or technical know-how to get it done — we’ve got you covered!
Just fill out the quick form below and let our expert team take care of the design for you.
We’ll deliver a polished, visually engaging SmartArt presentation tailored to your needs — fast and hassle-free!
Don’t wait — tell us what you need now!
Introduction to SmartArt PowerPoint
Visual storytelling is crucial in contemporary presentations—business, education, or marketing—anywhere.
Graphical material is absorbed by audiences significantly faster than written material.
Understanding this, Microsoft included the SmartArt tool in PowerPoint 2007.
With only a few clicks, SmartArt lets consumers translate regular bullet points and paragraphs into professional diagrams, infographics, and charts.
In the video below, you can see how a slide with simple text is designed using the SmartArt design feature.
SmartArt has developed over the past ten years into one of the most effective solutions available to non-designers to produce coherent, brand-aligned pictures without outside graphic software.
This article will teach you what SmartArt is, why it’s so beneficial, how to insert and configure SmartArt diagrams, tactics for animating them, advanced hints to go beyond defaults, frequent mistakes to avoid, and real-world use cases that show best practices.
 Learning SmartArt will improve your presentations and save you hours of hand-made design effort regardless of your requirement for a process flow, organizational chart, cyclic model, or picture-based layout.
1. What Is SmartArt in PowerPoint?
Built-in in Microsoft PowerPoint, SmartArt creates vector-based diagrams from text input automatically.
SmartArt uses Office Drawing Canvas and XML-based definitions for every layout behind the hood.
PowerPoint generates a collection of shapes and connections when you select a SmartArt category —such as List, Process, or Relationship—then organizes them according to a specified structure and adds theme-aware colors and effects.
When you change content, this method abstracts away manual shape construction, alignment, and spacing, therefore guaranteeing consistency and quick updates.
Every SmartArt graphic finds residence on the slide as a group object. Click directly on placeholders labeled contentor use theText Pane to change the underlying content.
As you add, delete, or reorganize objects, SmartArt automatically changes form sizes and placements.
Furthermore, «SmartArt visuals » are completely compatible with PowerPoint themes, therefore allowing the diagrams to inherit color palettes, typefaces, and effects matching your general presentation style.
2. Why Use SmartArt PowerPoint?
Before exploring mechanics, let me highlight the advantages SmartArt offers for your slides:
- Rapid Diagram Creation: Generate complex visuals in seconds instead of manually drawing each shape.
- Consistency & Branding: SmartArt respects your presentation’s theme, ensuring uniform colors, fonts, and styles.
- Scalability: Easily add or remove nodes; layouts adapt dynamically without manual repositioning.
- Clarity & Engagement: Diagrams reveal relationships, hierarchies, and processes more effectively than bullet lists.
- Accessibility: Screen readers can interpret SmartArt via alternative text set on shapes, improving document accessibility.
- Time Savings: Save hours on alignment, distribution, and formatting tasks that you’d otherwise perform by hand.
Whether you need to illustrate a five-step workflow, show a Venn diagram of overlapping concepts, or display an organizational hierarchy, SmartArt makes the task trivial while maintaining a polished appearance.
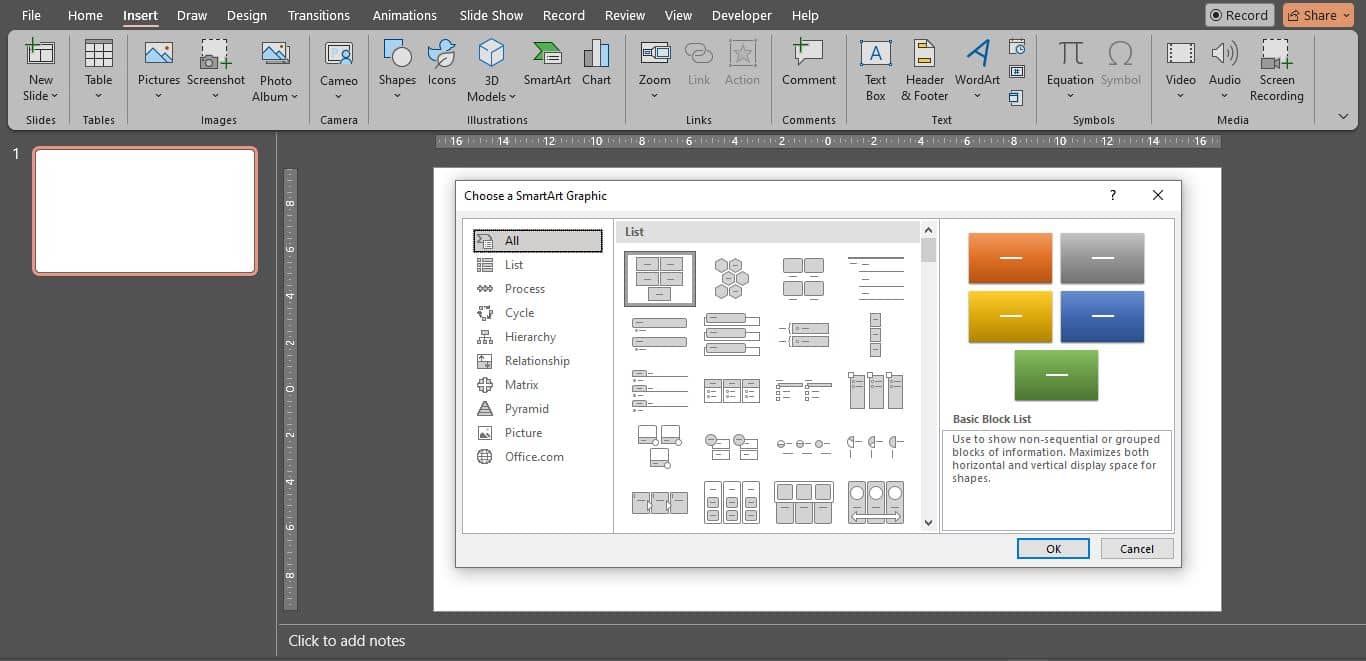
3. How to Insert SmartArt in PowerPoint
The steps are included in the initial video of this article. including a SmartArt graphic is not difficult. Use these exact instructions, step by step:
- Open your PowerPoint presentation and navigate to the slide where you want the graphic.
- On the ribbon, click the
Inserttab. - In the Illustrations group, click
SmartArt. The Choose a SmartArt Graphic dialog opens. - Browse categories on the left (List, Process, Cycle, Hierarchy, Relationship, Matrix, Pyramid, Picture).
- Click any layout to preview it. Once you find a layout that suits your content, click
OK. - The SmartArt graphic appears on the slide with placeholder shapes. Click the small arrow on the left to open the
Text Pane, or click each placeholder and type directly.
Pro Tip: Use the Text Pane whenever possible for bulk editing—this ensures your content flows into shapes correctly, and adding or removing items keeps the layout consistent.
Inserting a SmartArt graphic via the Insert SmartArt dialog
4. Overview of SmartArt Categories and Layouts
SmartArt has eight basic categories, each with several layouts meant for particular visual chores. We review every category below, explain their applications, and stress popular layouts.
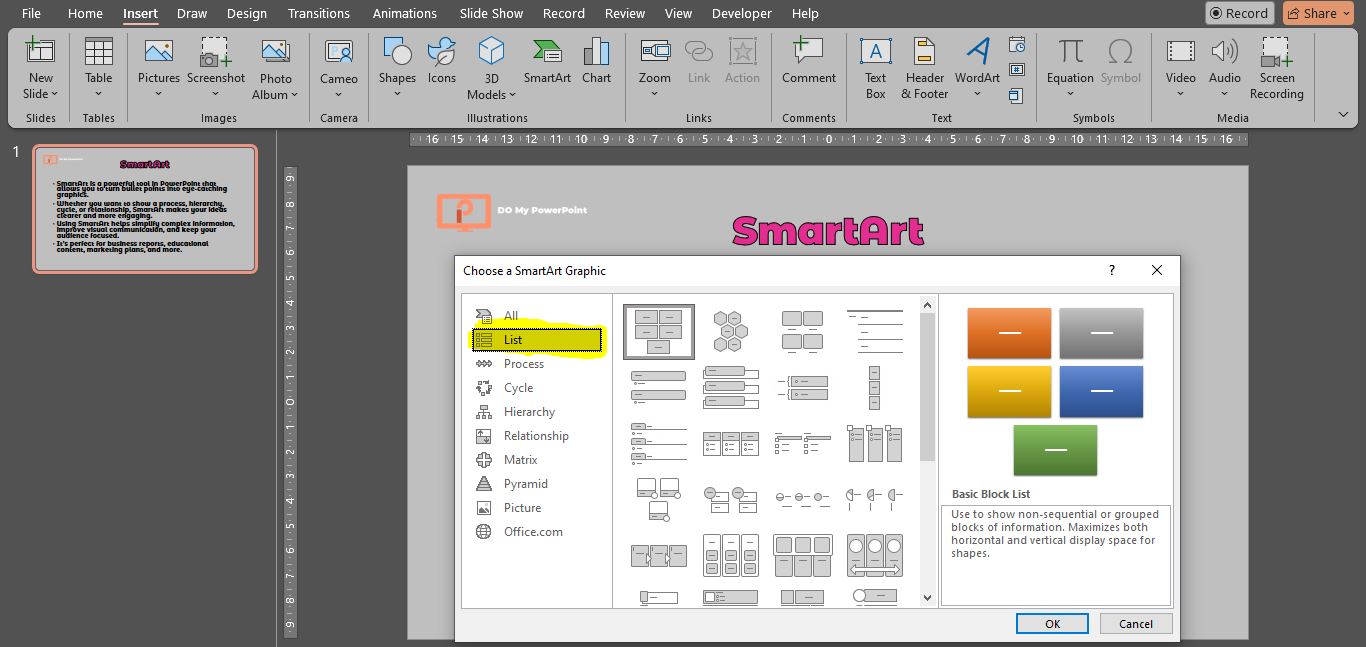
4.1 List
Use case: Present non-sequential data such as features, bullet lists, pros and cons, or checklists.
Popular layouts: Vertical Bullet List, Horizontal Bullet List, Picture Accent List, Bending Picture Accent List.
Example: A marketing slide showcasing five product features, each accompanied by an icon. Use the Picture Accent List layout to include small images alongside text for visual interest.
In this image, you can see the list section in SmartArt.
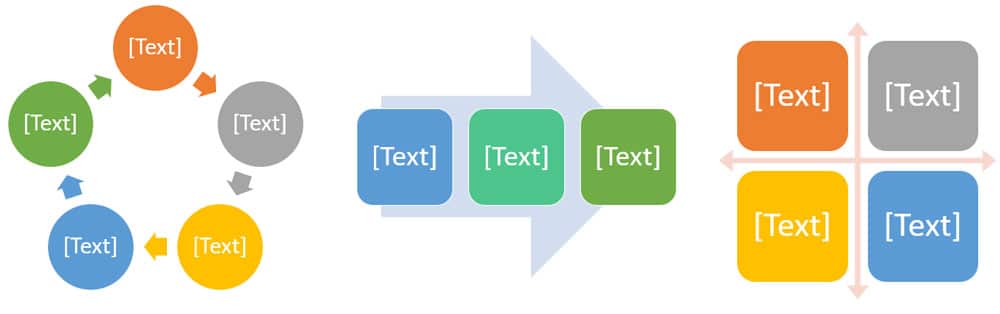
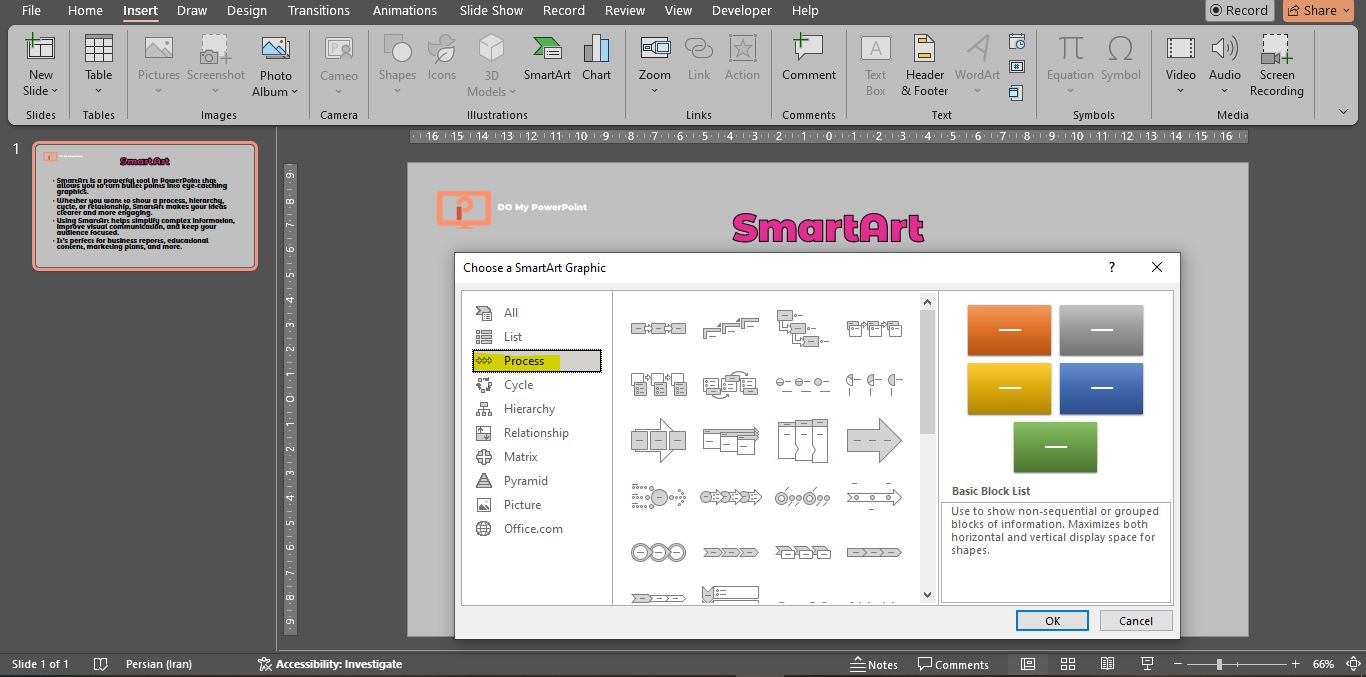
4.2 Process
Use case: Illustrate step-by-step workflows, timelines, or sequences.
Popular layouts: Basic Process, Chevron Process, Accent Process, Continuous Process, Picture Process.
Example: A project management slide outlining the five phases of product development. Use Chevron Process, assign each chevron a distinct theme color, and animate “By Paragraph” so each step appears sequentially.
In this image, you can see the Process section in SmartArt.
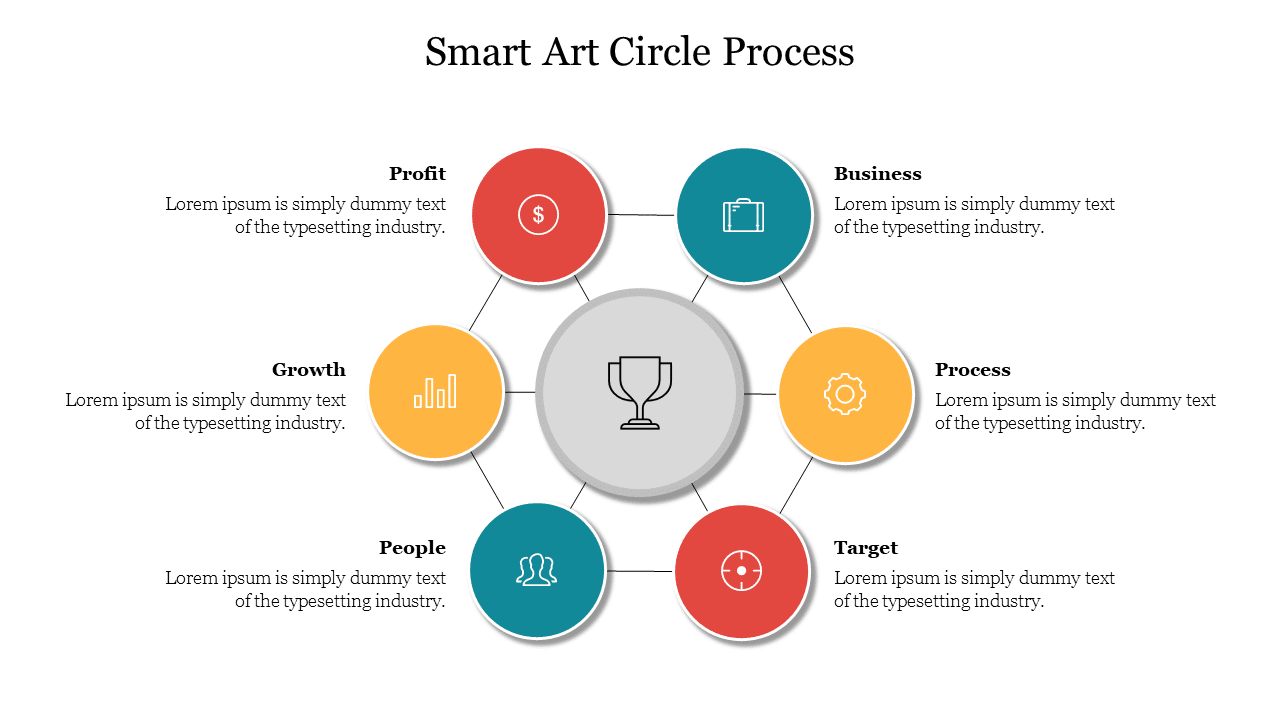
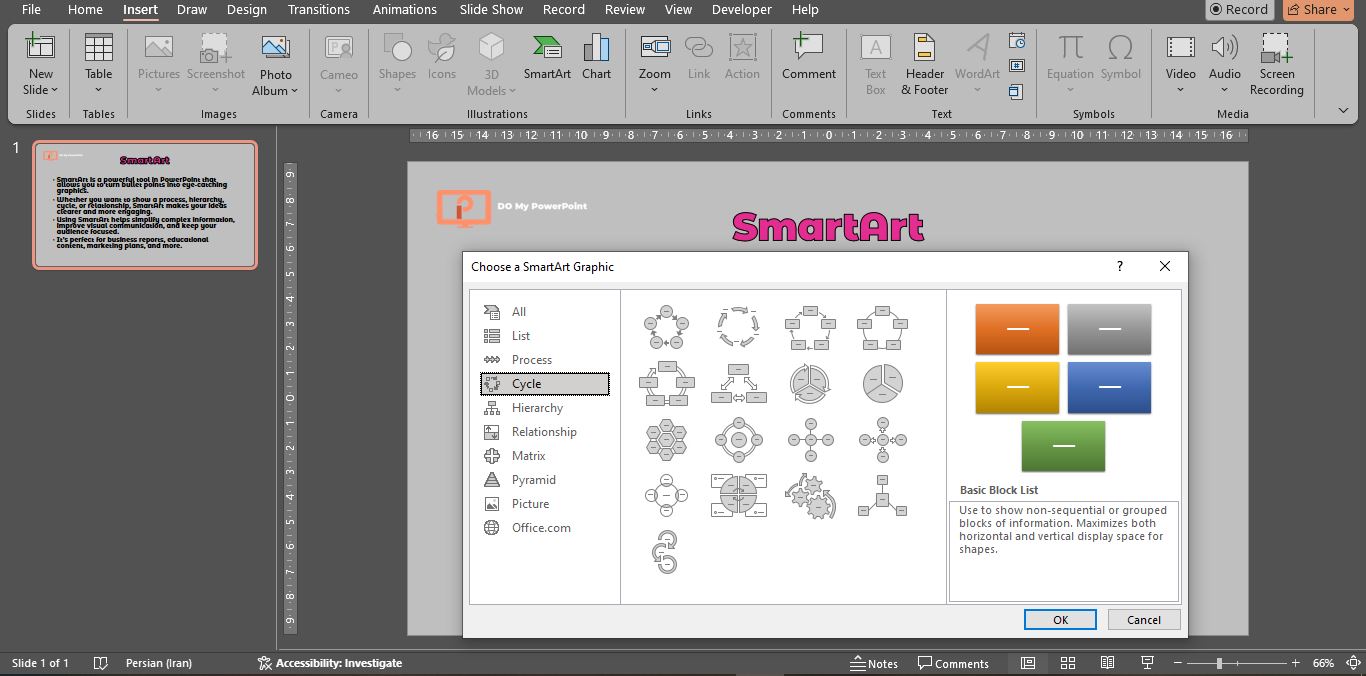
4.3 Cycle
Use case: Show circular workflows, feedback loops, or repeating stages.
Popular layouts: Basic Cycle, Continuous Cycle, Radial Cycle, Text Cycle.
Example: A quality improvement model with Plan → Do → Check → Act phases. The Basic Cycle layout provides a clear visual loop that reinforces the iterative nature of the process.
In this image, you can see the Cycle section in SmartArt.
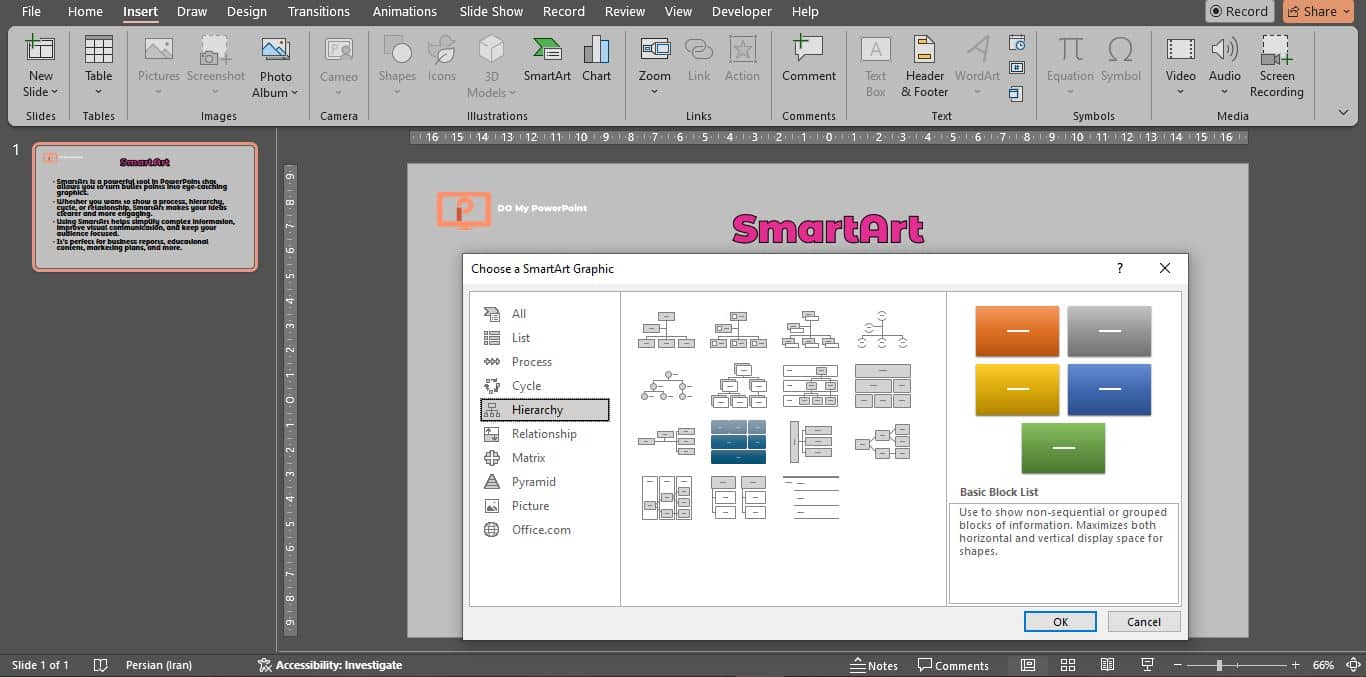
4.4 Hierarchy
Use case: Display organizational charts, family trees, decision trees, or taxonomies.
Popular layouts: Organization Chart, Labeled Hierarchy, Picture Organization Chart, Table Hierarchy.
Example: A corporate leadership slide showing CEO at the top with VPs and department heads below. Use Picture Organization Chart to insert executive headshots for personalization.
In this image, you can see the Hierarchy section in SmartArt.
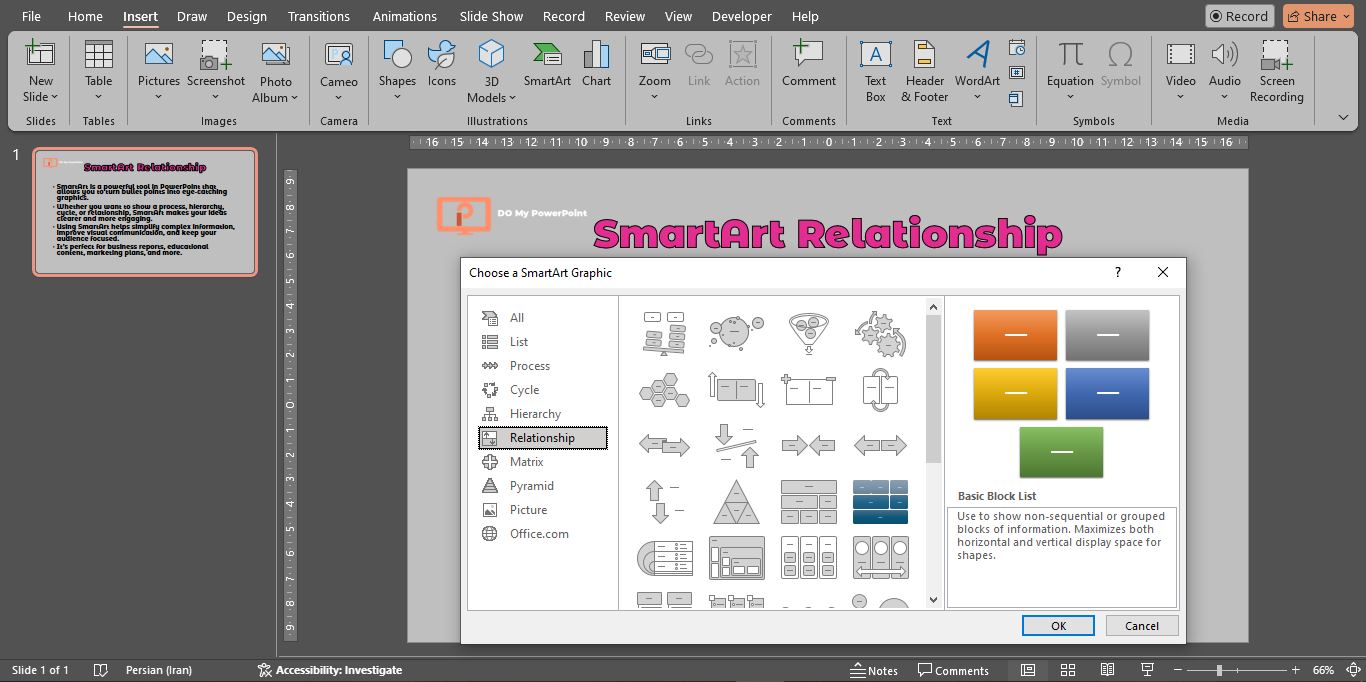
4.5 Relationship
Use case: Emphasize connections between items, correlations, or interactions.
Popular layouts: Venn Diagram, Basic Venn, Radial Cluster, Diverging Radial.
Example: A strategic planning slide depicting overlapping market segments. The Basic Venn layout visually communicates shared and distinct customer groups.
In this image, you can see the list section in SmartArt.
In this image, you can see the Relationship section in SmartArt.
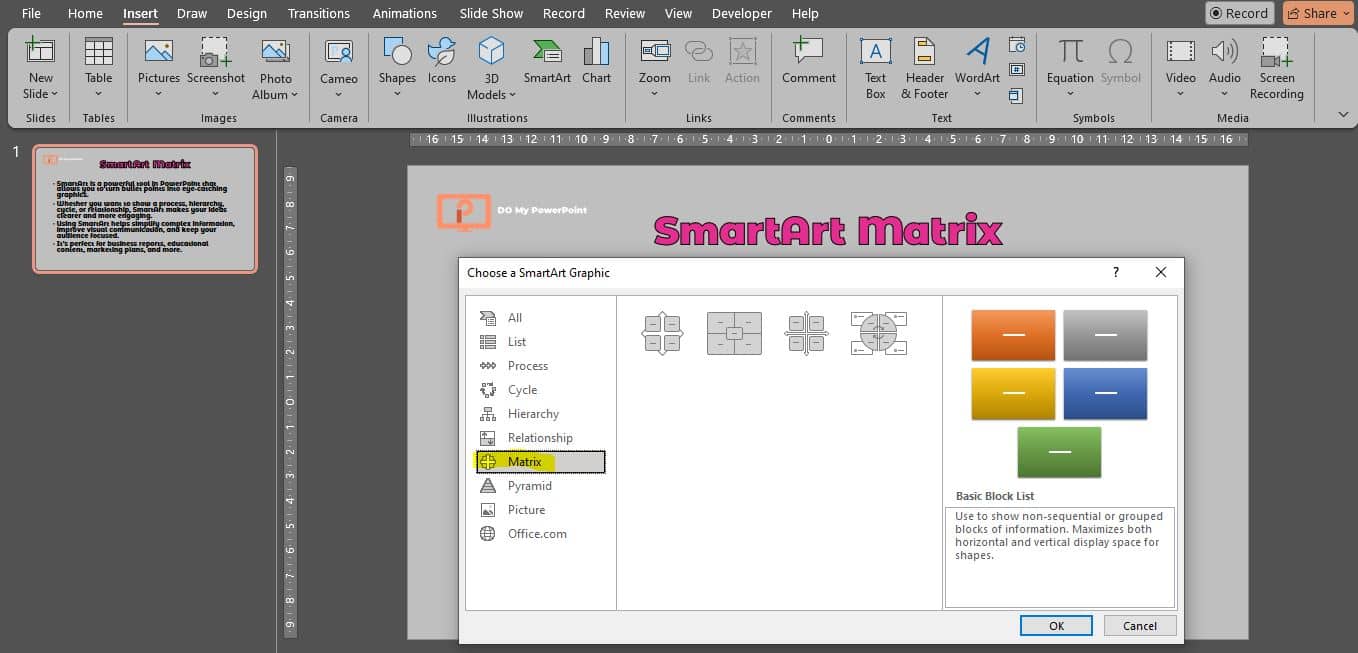
4.6 Matrix
Use case: Compare items along two axes, such as impact vs. effort, risk vs. reward, or SWOT analyses.
Popular layouts: Basic Matrix, Grid Matrix, 4-Quadrant Matrix.
Example: A risk assessment matrix plotting probability against impact. Use the 4-Quadrant Matrix and color-code each quadrant for quick interpretation.
In this image, you can see the Matrix section in SmartArt.
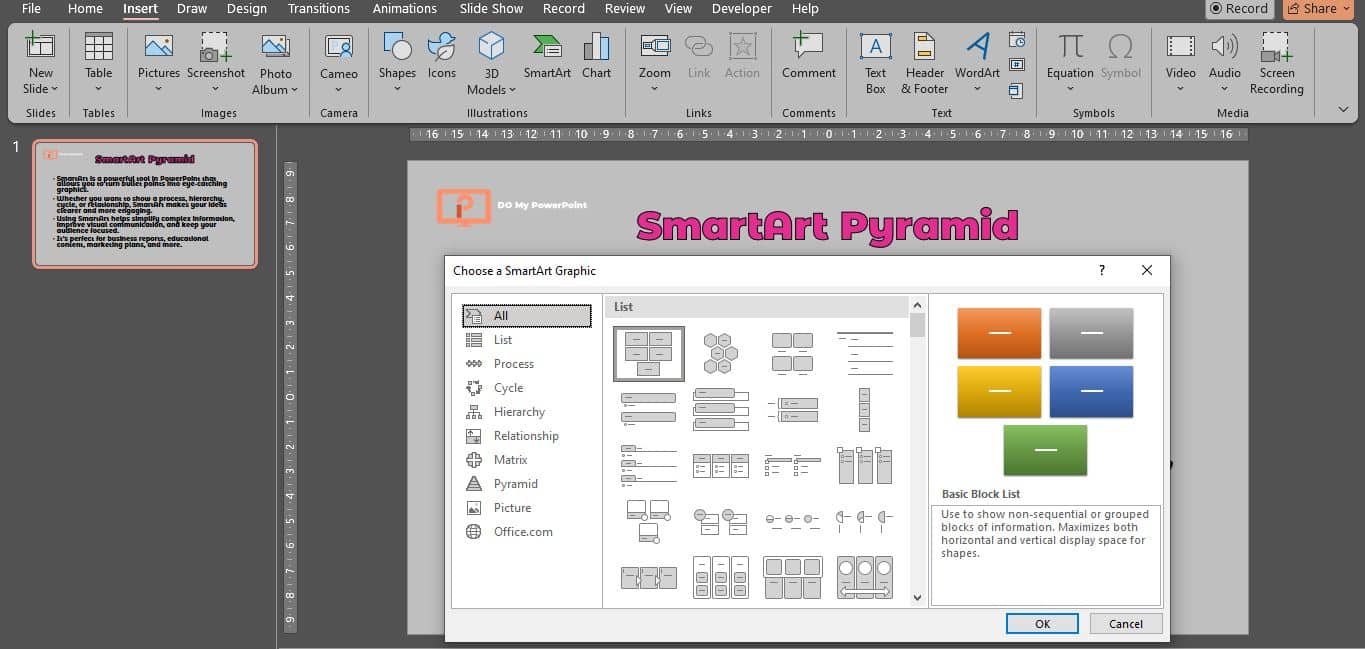
4.7 Pyramid
Use case: Show proportional relationships, hierarchies of needs, or funnel diagrams.
Popular layouts: Basic Pyramid, Inverted Pyramid, Pyramid List.
Example: A training slide representing learning priorities. Use Basic Pyramid with levels for Knowledge, Comprehension, Application, Analysis, and Synthesis.
In this image, you can see the Pyramid section in SmartArt.
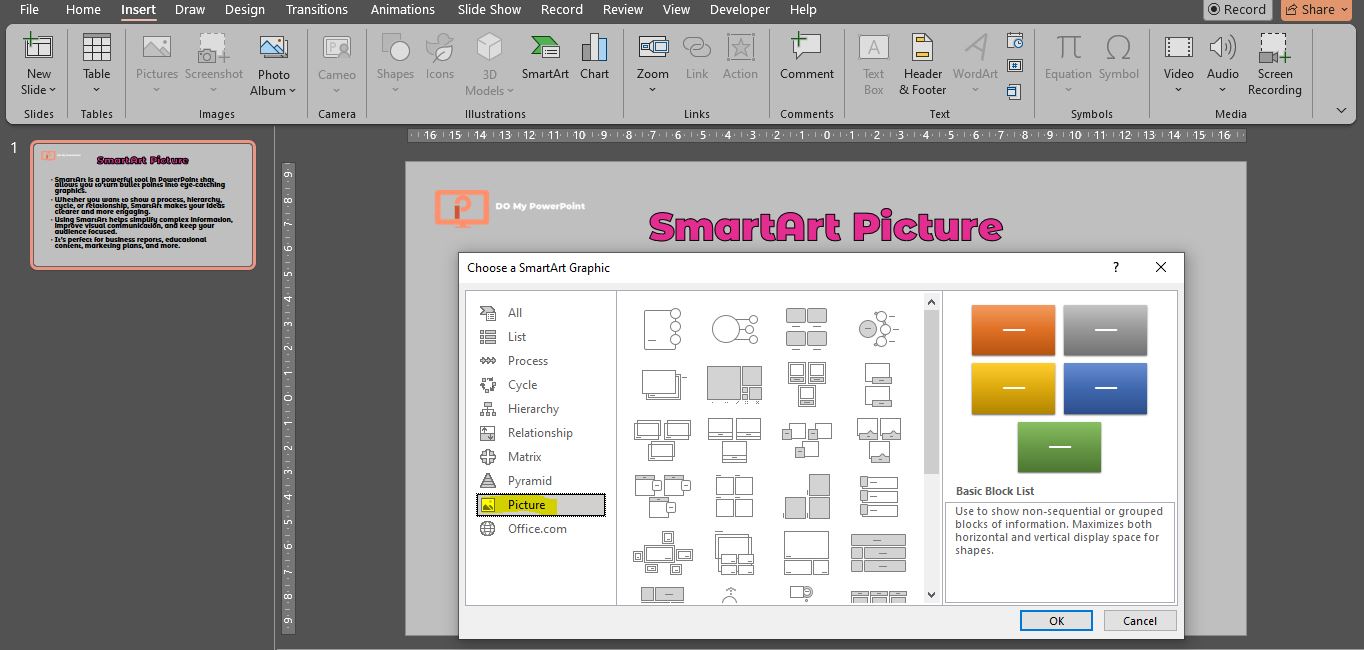
4.8 Picture
Use case: Combine images and text to tell a story or showcase examples.
Popular layouts: Picture Accent Process, Picture Grid, Picture Decorative.
Example: A case study slide featuring client testimonials. Use Picture Grid to display headshots alongside quotes, enhancing credibility.
In this image, you can see the Picture section in SmartArt.
5. Customizing Your SmartArt PowerPoint Graphics
In the video below, published on the educational video channel of the Do My PowerPoint site, you will be taught important tips for editing SmartArt.
You probably want to customize a layout to fit your brand or presentation theme after you have chosen one. Important phases of customizing consist in:
5.1 Change Color Schemes
- Select the SmartArt graphic.
- Under
SmartArt Tools → Design, clickChange Colors. - Pick from Theme Colors or Standard Colors palettes.
5.2 Apply SmartArt Styles
Also on the Design tab, choose from the SmartArt Styles gallery to add 2D, 3D, or shadow effects in one click.
5.3 Edit Individual Shapes
- Click a specific shape within the SmartArt.
- Go to the
Formattab under SmartArt Tools. - Use
Shape Fill,Shape Outline, andShape Effectsto adjust color, border weight, shadow, glow, or 3D rotation.
5.4 Add or Remove Shapes
- Select the SmartArt graphic.
- Under
Design, clickAdd Shape, then choose Above, Below, or After. - To remove a shape, click it and press Delete.
5.5 Resize and Reposition
Resize all forms proportionately by dragging the bounding box handles. Click and drag the whole graphic’s border to move it on the slide.
6. Converting Text to SmartArt
If you already have bullet points or numbered lists, convert them into SmartArt:
- Select the text box containing your list.
- Right-click and choose
Convert to SmartArt. - Pick a layout; PowerPoint automatically creates shapes and maps each bullet to a shape.
This method preserves indentation levels: sub-bullets develop in the hierarchy like child forms. It’s a quick approach for reusing already-published material.
7. Animating SmartArt Diagrams
Dynamic animations help guide audience attention step by step. To animate SmartArt:
- Select the SmartArt graphic.
- Click the
Animationstab. - Choose an entrance effect (Appear, Fade, Wipe, Fly In).
- Open
Effect Optionsand select By Paragraph or One by One to animate each shape sequentially. - Open the
Animation Paneto adjust timing, order, and delays.
Tip: Limit animations to significant portions for complicated diagrams with numerous nodes to prevent overwhelming viewers. For a professional image, use subdued fades instead of spectacular starts.
8. Advanced SmartArt PowerPoint Techniques
- Convert to Freeform Shapes: After finalizing SmartArt, right-click and choose
Convert to Shapes. Ungroup the elements (Ctrl+Shift+G) to edit each shape independently, apply custom vector points, or merge shapes. - Replace Icons with SVGs: Download or design SVG icons, insert them via
Insert → Pictures, thenChange Shapeto swap default SmartArt bullet shapes with your SVG for branded visuals. - Layer Multiple SmartArt: Combine two SmartArt graphics on a single slide, adjust transparency on one (
Format → Transparency), and useBring Forward/Send Backwardfor layered effects. - Create Reusable Templates: Once a diagram is styled, right-click the SmartArt container and select
Save as Template. Store in your Custom Office Templates folder for quick access in future presentations. - Data-Linked Diagrams: Use third-party add-ins or VBA to link SmartArt text fields to Excel cells. When data updates in Excel, your SmartArt diagram refreshes automatically, ideal for dynamic dashboards.
9. Common Mistakes and How to Avoid Them
Even with SmartArt, presenters can fall into design traps. Here are pitfalls and remedies:
- Overcrowding Shapes: Too much text in one shape reduces readability. Remedy: Break the diagram into smaller segments or use multiple slides.
- Inconsistent Styling: Mixing multiple SmartArt styles on one slide causes visual chaos. Remedy: Stick to one style and color palette.
- Excessive Animations: Overly dramatic or numerous animations distract rather than inform. Remedy: Use simple entrance effects and animate key points only.
- Poor Contrast: Light text on light fills or dark text on dark fills hinders readability. Remedy: Ensure sufficient contrast between text and background.
- Neglecting Accessibility: Forgetting alt text for exported diagrams or inaccessible color choices. Remedy: Add meaningful alt text to the grouped SmartArt image and check color contrast.
10. Real-World Examples & Use Cases
10.1 Product Roadmap Presentation
A product manager used the Chevron Process SmartArt to outline quarterly roadmap milestones. Each chevron was color-coded by quarter. In the slide deck, the manager animated each chevron “By Paragraph” to narrate one milestone at a time, ensuring stakeholder focus.
10.2 Team Organizational Chart by SmartArt PowerPoint
An HR director built a three-level hierarchy using Picture Organization Chart. Employee photos replaced default icons. The chart was included in the company handbook and exported as SVG for the intranet, preserving vector quality and interactivity.
10.3 SWOT Analysis by SmartArt PowerPoint
A marketing team employed the 4-Quadrant Matrix layout to present SWOT findings. They custom-filled each quadrant—Strengths in green, Weaknesses in red, Opportunities in blue, Threats in orange—and added fade animations for each quadrant to appear sequentially during the presentation.
11. Frequently Asked Questions
Can I edit SmartArt on mobile versions of PowerPoint?
Yes, PowerPoint Mobile (iOS/Android) supports basic insertion and editing of SmartArt, though advanced formatting options are limited.
How do I export SmartArt as a high-resolution image?
Right-click the SmartArt group, select Save as Picture, choose PNG or SVG at the highest resolution, and specify dimensions in the dialog.
Does SmartArt work in PowerPoint for Mac?
Yes. Mac versions (2011+) include SmartArt with nearly identical features to Windows, though some animations and effects may differ slightly.
Can I animate SmartArt in PowerPoint Online?
PowerPoint Online allows basic animations on SmartArt, but the web interface lacks the full set of Effect Options found in desktop versions.
12. Related Articles & Services
Conclusion
Learning SmartArt PowerPoint will enable you to design attractively and fast diagrams conveying difficult knowledge.
This article has addressed the whole SmartArt process from choosing the suitable layout and setting styles to animating every piece for best effect.
Keep consistency, guarantee readability, and use professional animations sparingly to help you avoid typical design mistakes.
Effective integration of SmartArt will not only make your presentations seem professional but also more strongly engage and enlighten your audience.
Ready to elevate your slide decks? Explore our PowerPoint design services or review our pricing plans to get started with expert assistance today.


John Williams
Thanks for the article! These smartart powerpoint tips were to the point and extremely helpful for my own Corporate profile templates uae business.
amir
Please, SmartArt is an interesting feature in PowerPoint, and if you learn it professionally, it will help your presentations a lot.