
How to Create a Venn Diagram in PowerPoint
Venn diagrams are great tools for showing connections between several sets and thus quite useful in presentations in several disciplines. Microsoft PowerPoint provides several ways to create these diagrams, so accommodating both novice and experienced users. This article will walk over how to make a Venn diagram in PowerPoint so that your presentations are aesthetically pleasing and instructive.
Appreciating Venn Diagrams
A Venn diagram shows the logical connections among several sets by use of overlapping circles. Every circle stands for a set; the overlapping portions highlight the commonalities among these sets.
This graphic approach helps viewers to understand difficult material by simplifying it.
Methods to Create Venn Diagrams in PowerPoint
PowerPoint provides several approaches to creating Venn diagrams, each with its own advantages.
1. Using SmartArt Graphics
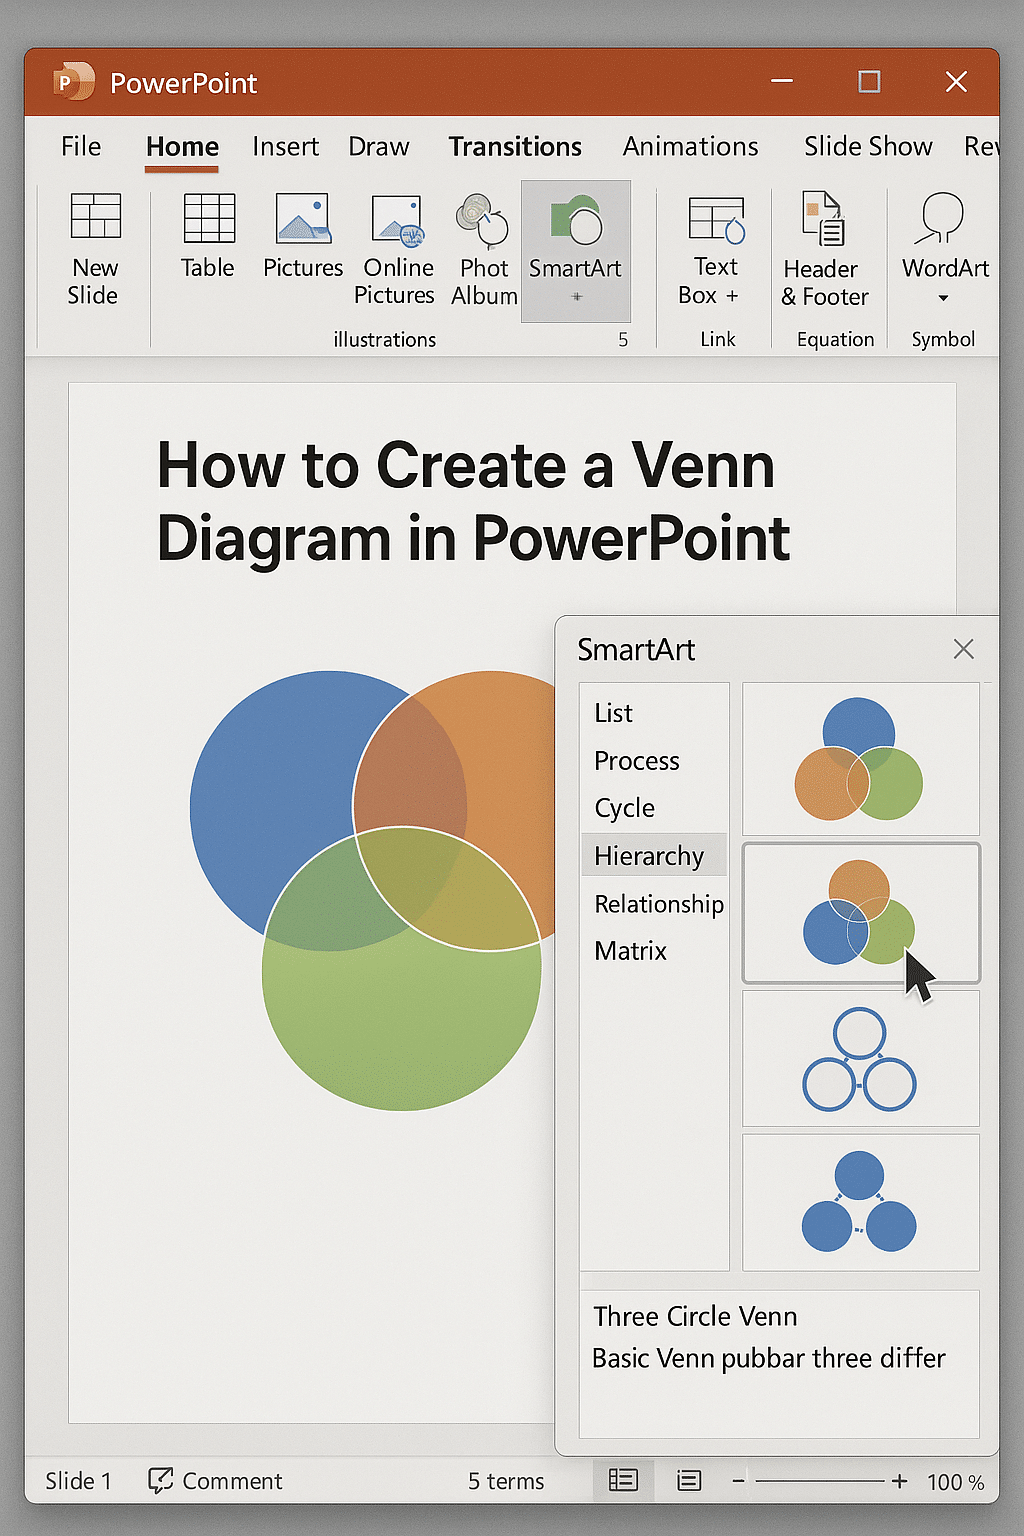
SmartArt is a built-in feature in PowerPoint that allows users to create diagrams quickly. Here’s how to create a Venn diagram using SmartArt:
- Navigate to the Insert tab.
- Click on SmartArt in the Illustrations group.
- In the Choose a SmartArt Graphic dialog box, select Relationship.
- Choose Basic Venn and click OK.
- Click on the circles to add text, or use the text pane to input your data.
The picture below graphically illustrates what spoken above. It shows how to personalize a Venn diagram using the SmartArt tool and improve its attractiveness with animations and varied color schemes.
2. Using Shapes and the ‘Fragment’ Tool
For greater control over your Venn diagram’s appearance and functionality:
- Go to the Insert tab and select Shapes to draw circles representing each set.
- Overlap the circles to illustrate the relationships between sets.
- Select all the circles, then navigate to the Shape Format tab.
- Click on Merge Shapes and choose Fragment.
This action divides the overlapping areas into separate segments, allowing you to customize each part individually.
This method enables you to apply different colors, add specific text to each segment, and animate parts of the diagram separately, enhancing the visual impact of your presentation.
3. Utilizing Pre-made Templates
For a time-saving option, consider using pre-designed Venn diagram templates:
- Visit template websites like Slidesgo or Canva.
- Search for “Venn diagram” templates and select one that fits your presentation’s theme.
- Download the template in PowerPoint format.
- Open the file in PowerPoint and customize the text, colors, and other elements as needed.
Templates offer professionally designed visuals that can be easily tailored to your content, ensuring a polished and cohesive look.
Best Practices for Designing Venn Diagrams
To design a Venn diagram with efficacy:
- Every circle should clearly reflect a unique set, while the overlapping portions highlight the relationships.
- To improve readability, use opposing colors for each set and at their crossings.
- Clearly name every part of the diagram to communicate the intended information.
- Simplicity: Steer clear of too many sets or too much text stuffing the graphic with to confuse the audience.
Enhancing Engagement with Animation
Animating your Venn diagram can help emphasize key points:
- Select the segment or text you wish to animate.
- Go to the Animations tab and choose an appropriate animation effect.
- Use the Animation Pane to adjust the timing and order of animations, guiding your audience through the diagram step by step.
This dynamic approach can make your presentation more engaging and aid in audience comprehension.
Need Assistance with Your PowerPoint Presentations?
We are here to assist if building a convincing PowerPoint presentation or a Venn diagram seems daunting. Our staff specializes in creating visually appealing presentations specifically for your needs.
👉 Explore our PowerPoint design services
For detailed information on our offerings and pricing:
👉 Visit our pricing page
Let us simplify presentation design so you could concentrate on properly presenting your message.
Frequently Asked Questions (FAQ)
Below, we will answer eight common questions about venn diagrams in powerpoint.
1. What is the easiest way to create a Venn diagram in PowerPoint?
The simplest method is to use PowerPoint’s built-in SmartArt Graphics. Go to Insert > SmartArt > Relationship > Basic Venn, and then add your content. This is a quick way to create a «venn diagram in ppt» without needing design skills.
2. Can I customize each part of the Venn diagram?
Yes. If you want full control over design, use the Shapes tool and the Merge Shapes > Fragment feature. This allows you to apply different colors, text, and animations to each overlapping segment of your «venn diagrams in PowerPoint».
3. How do I animate parts of a Venn diagram?
To animate, select the shapes or text, go to the Animations tab, and choose an effect. Use the Animation Pane to adjust timing. This technique is helpful when you’re presenting a complex «venn diagram in ppt» and want to guide your audience gradually.
4. Is there a way to download ready-made Venn diagram templates for PowerPoint?
Absolutely. Many websites like SlidesGo, Envato, and Canva offer free and premium templates. Download one, open it in PowerPoint, and customize it. This is a great way to «create venn diagram in PowerPoint» quickly and professionally.
5. Can I use more than two or three circles in a Venn diagram?
Yes, but keep it simple. While PowerPoint allows adding more circles, too many overlaps can confuse your audience. Ideally, limit your «venn diagram in ppt» to 2–4 sets unless you’re using it for academic or data-heavy presentations.
6. Does PowerPoint support interactive Venn diagrams?
While PowerPoint isn’t inherently interactive, you can use hyperlinks, triggers, and animations to simulate interaction. For advanced interaction, consider exporting to web tools or integrating with Microsoft Excel.
7. How can I make a Venn diagram that matches my brand colors?
When you «create venn diagram in PowerPoint», select each shape and use the Shape Fill tool to apply custom colors. You can also save a custom theme under Design > Themes to maintain consistent branding.
8. Is there a difference between “SmartArt Venn” and “Custom Venn”?
Yes. SmartArt Venns are pre-built and fast, but they have limitations in design and animation. Custom Venn diagrams (using shapes) offer more flexibility and are ideal when you want to «create venn diagram in PowerPoint» with full creative control.
Conclusion
Ultimately, learning how to create venn diagrams in PowerPoint will greatly improve your capacity for clearly and aesthetically presenting ideas.
There are several approaches to create venn diagram in PowerPoint that fit different presentation styles and degrees of complexity whether your preferred tool is SmartArt, custom shapes, or downloaded templates.
Knowing how to construct a venn diagram on PowerPoint or how to create a venn diagram on PowerPoint helps you to turn abstract relationships into striking images.
Using venn diagrams in PowerPoint is a tried-and-true approach for clear communication whether your presentation is business case, scientific idea explanation, strategy comparison, or others.
Therefore, think about using a venn diagram in ppt next time you set up a presentation to include your audience and clearly transmit your point.


